Reporting and forecasting
Know where you'll land, before the quarter does
Dashboards your whole team can share, a forecast against quota, and funnel analytics that show where deals slow down. All of it from the data you already keep, with no spreadsheet on the side.
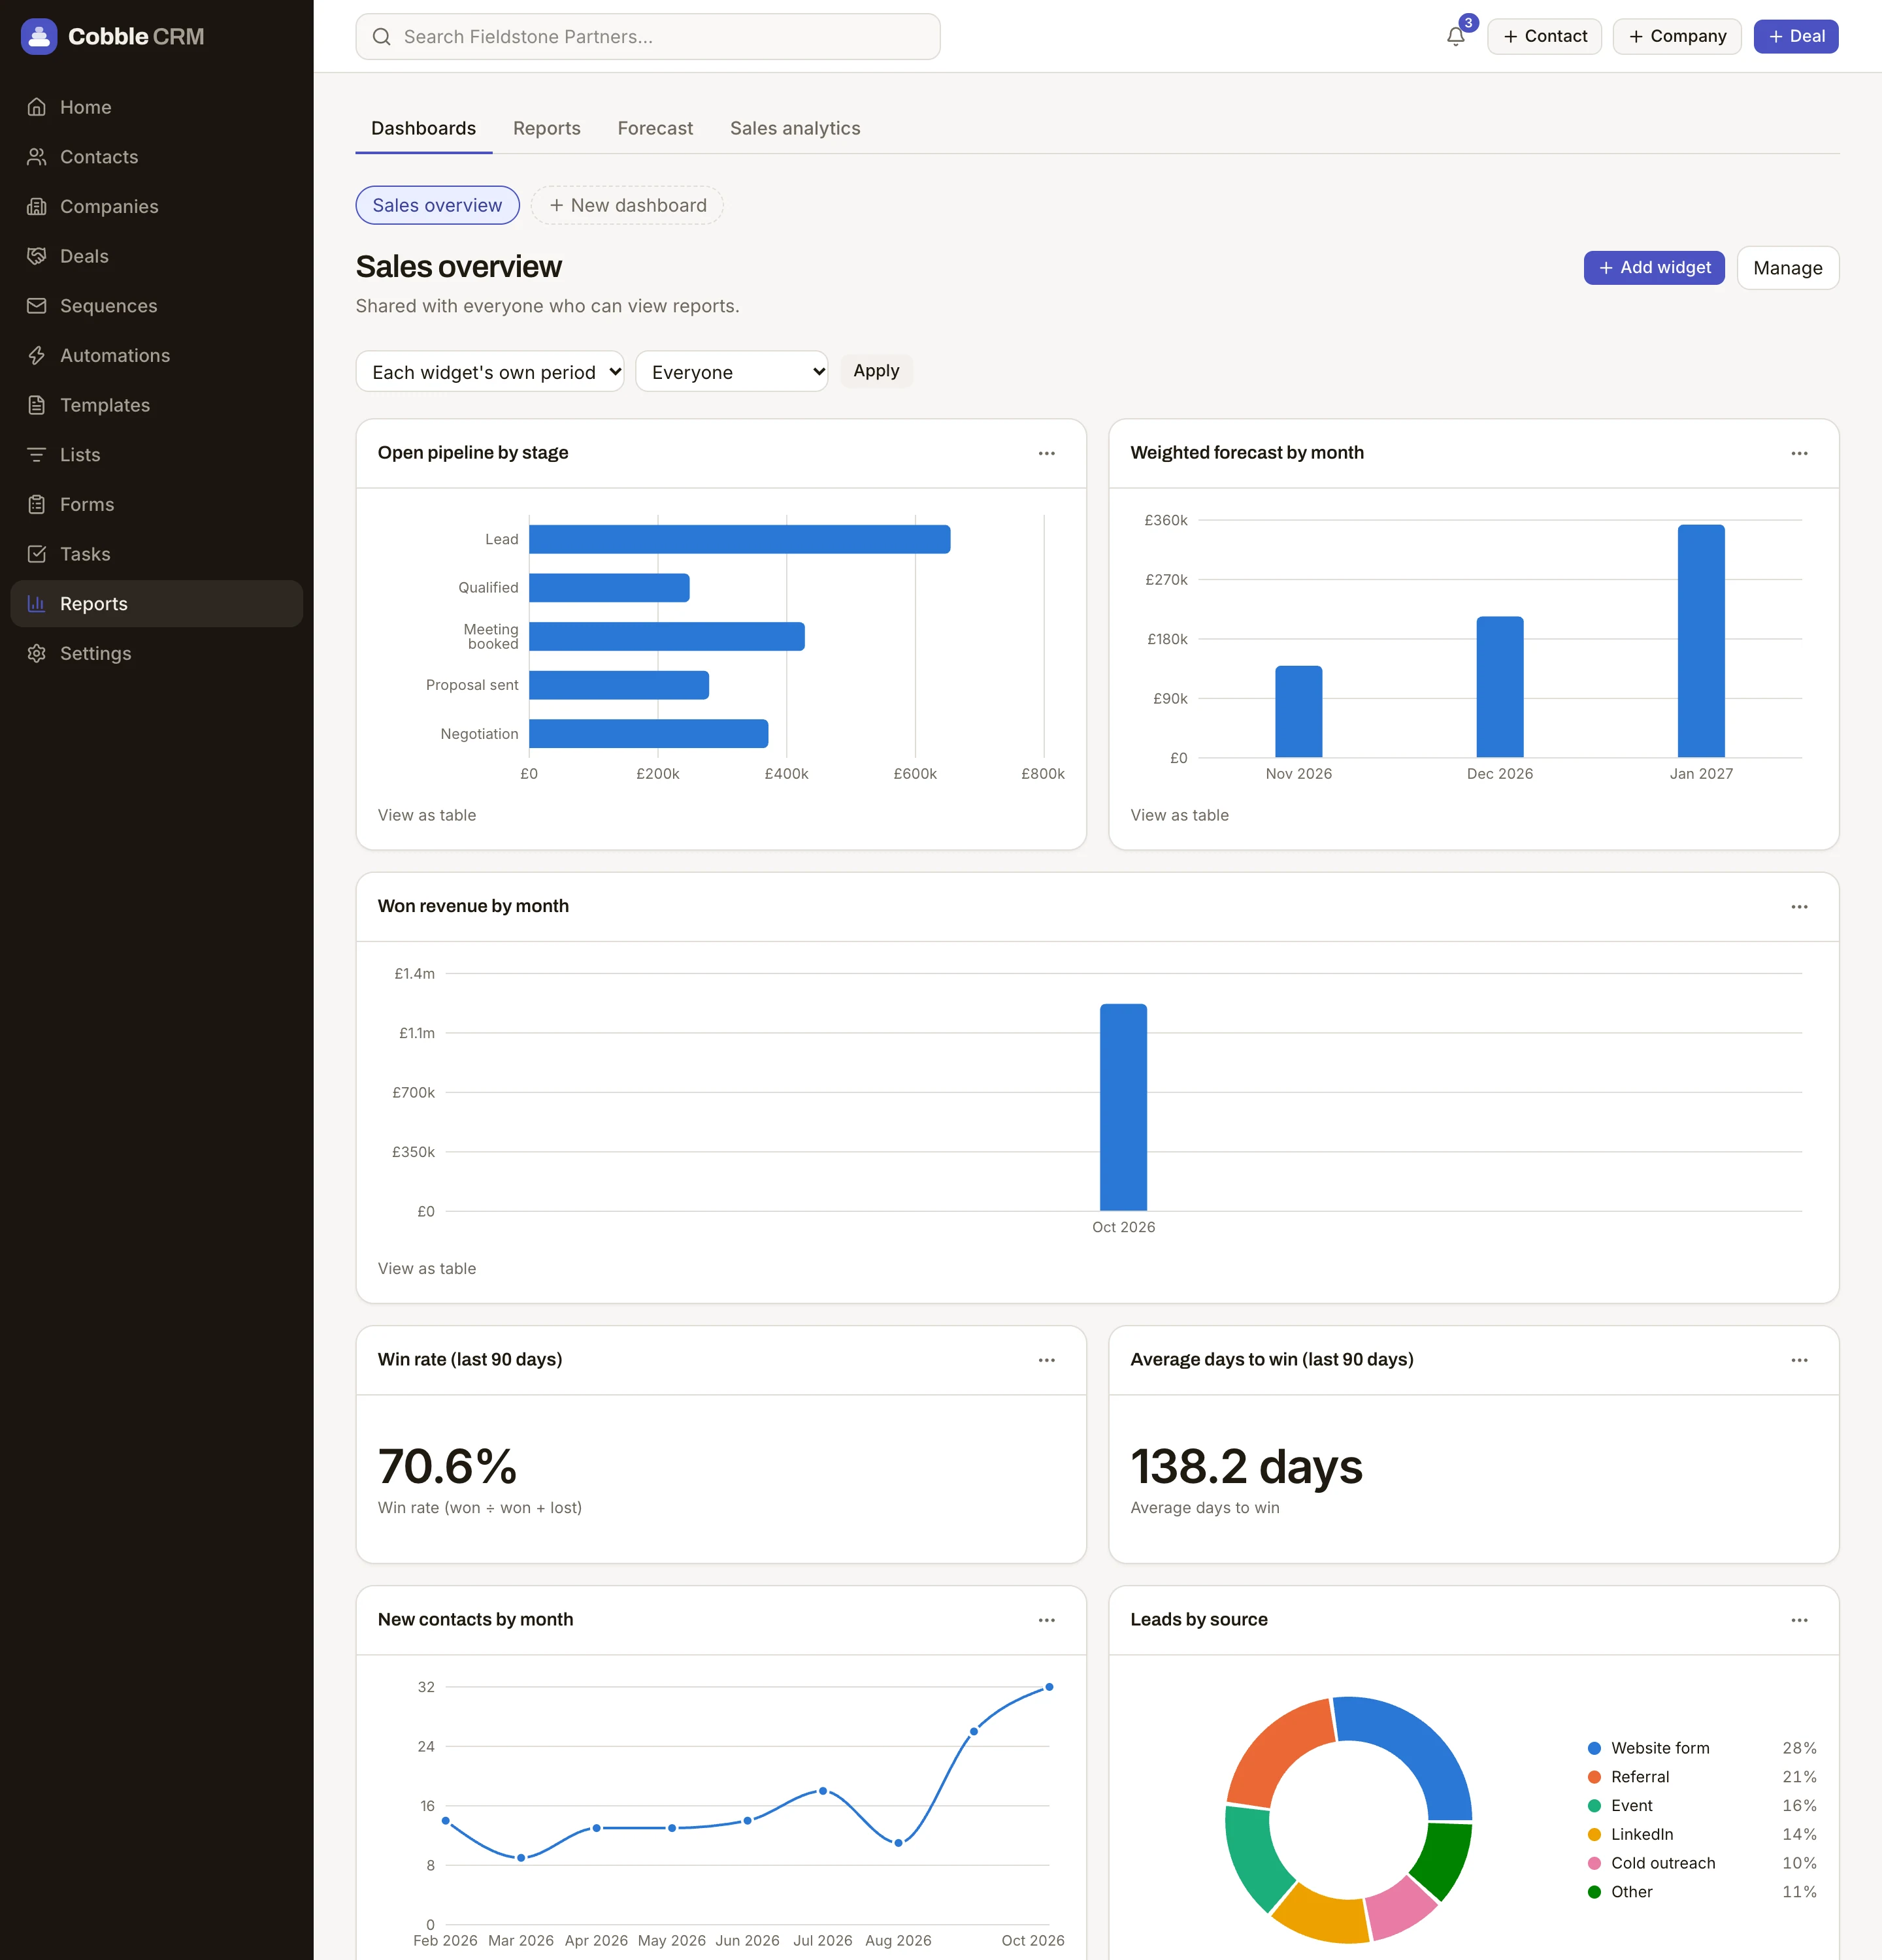
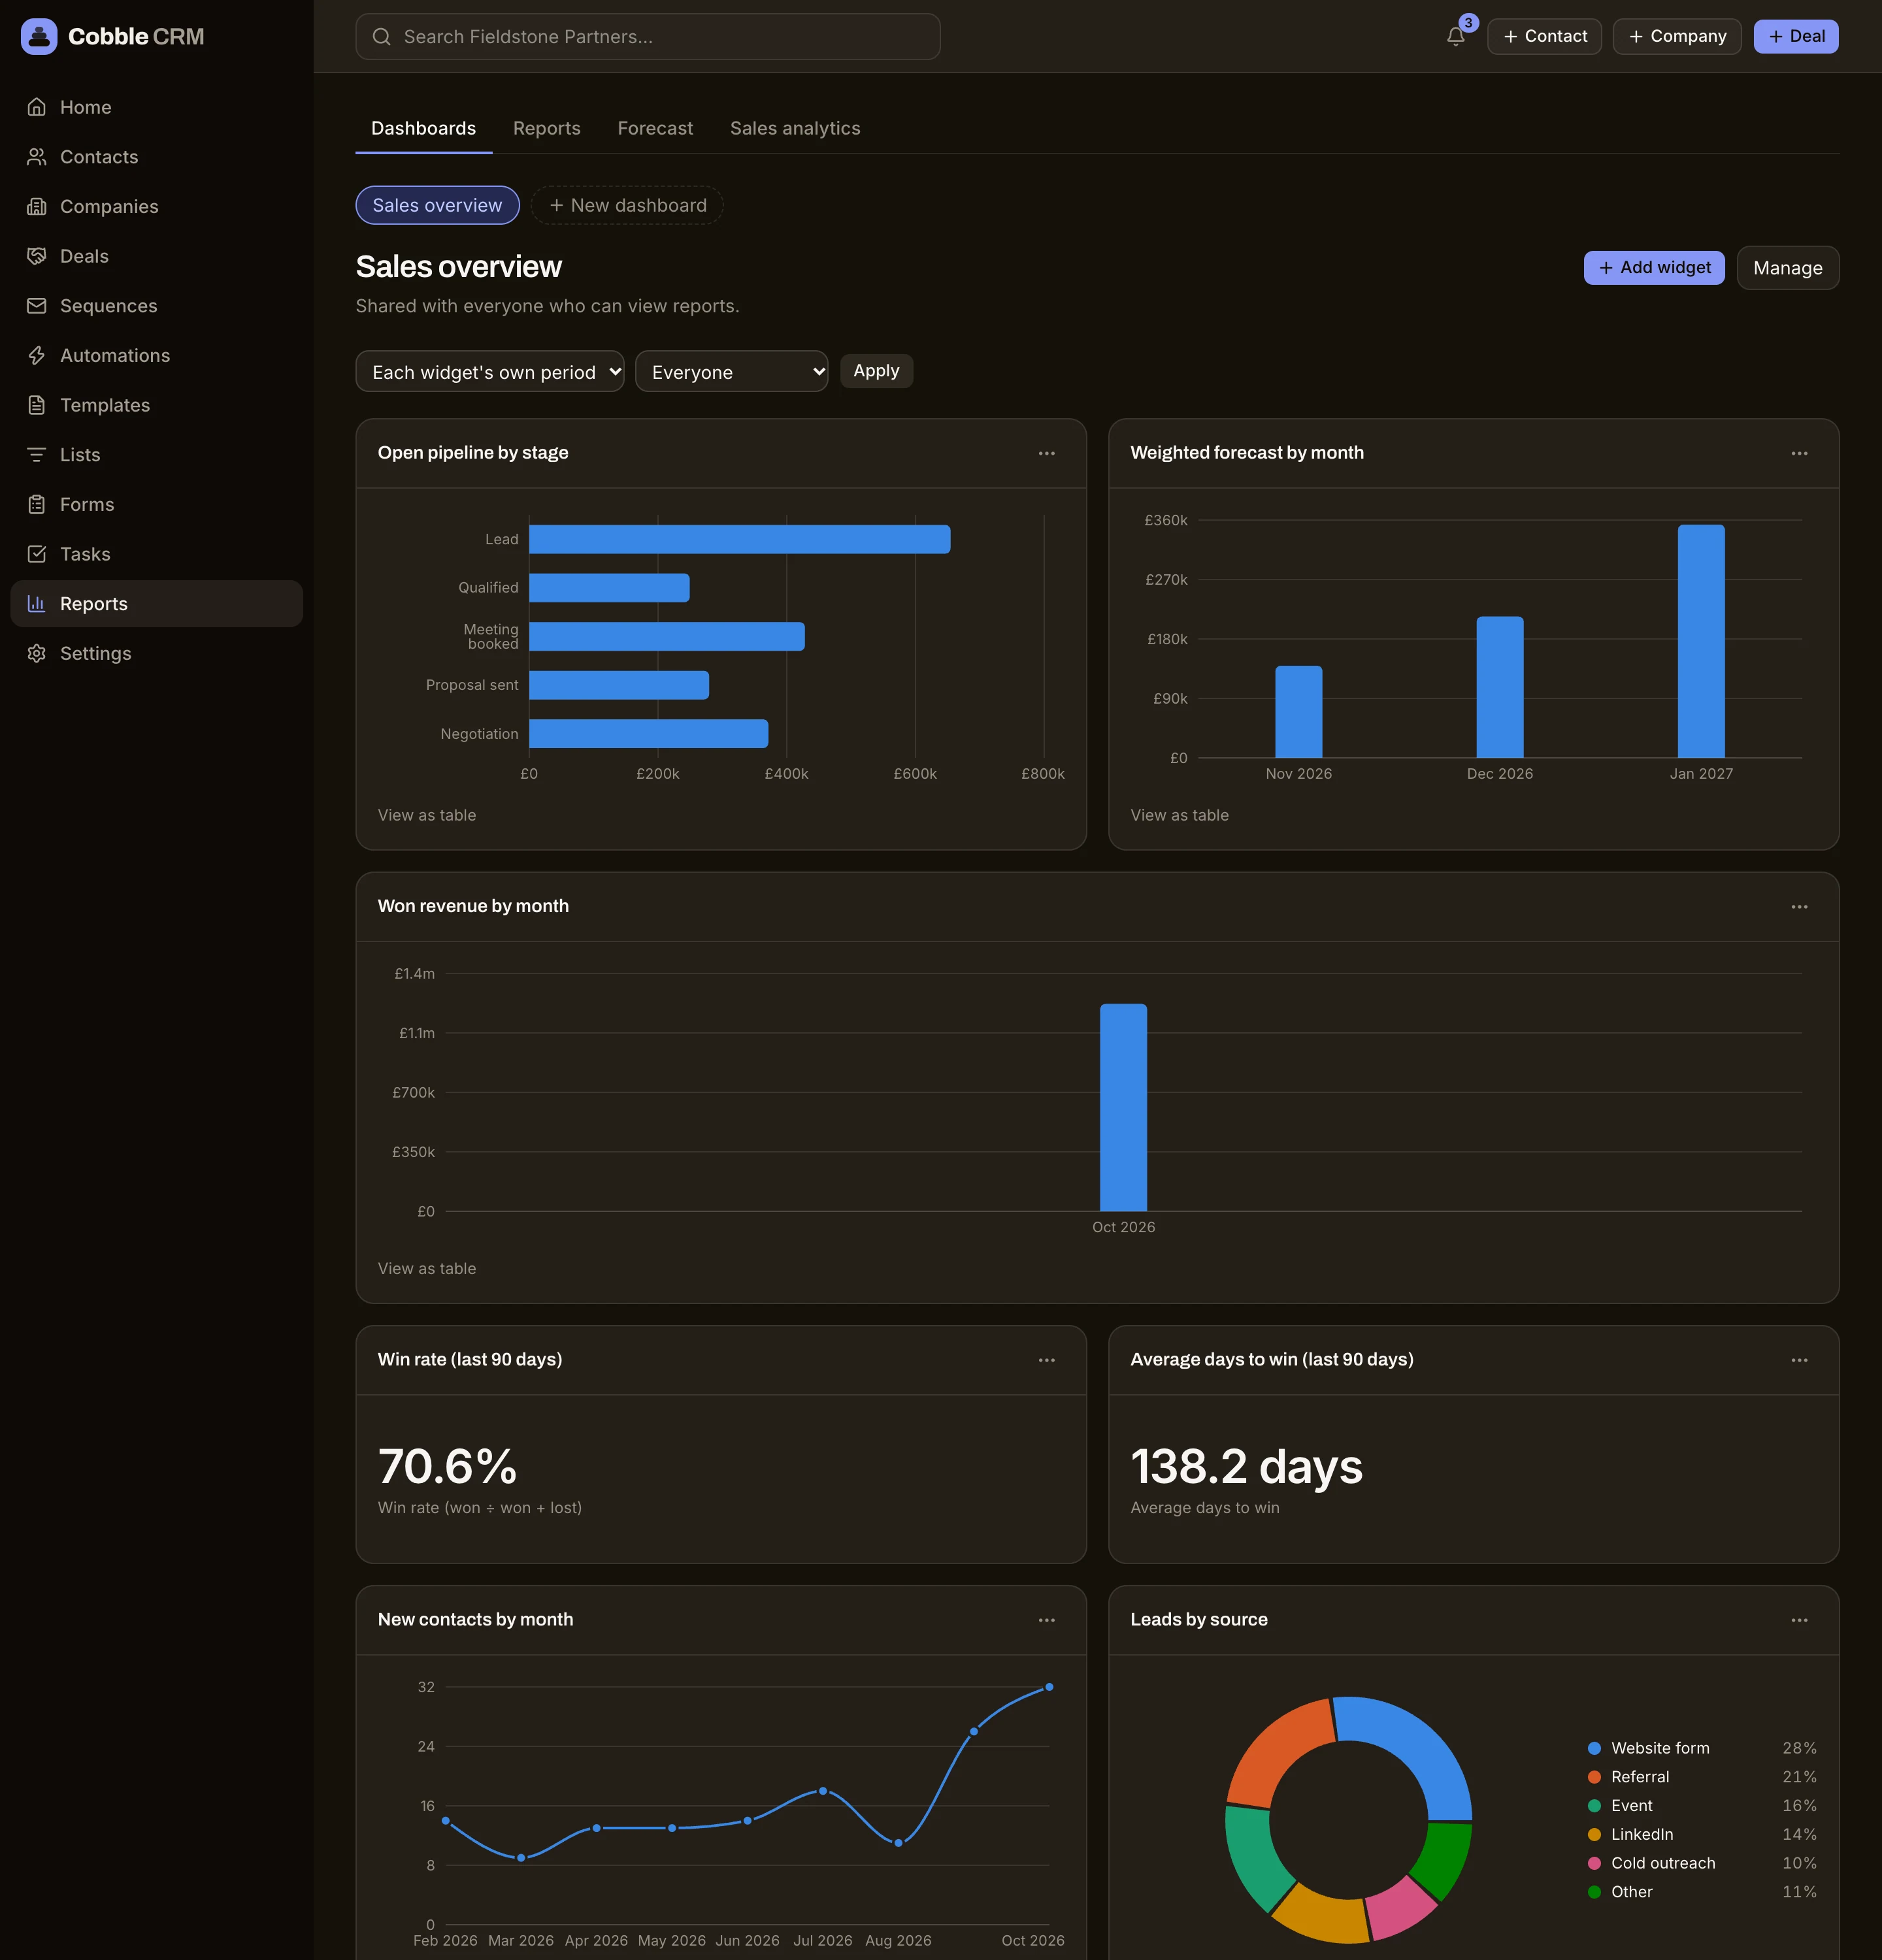
Dashboards you can share
Compose your own from widgets and share one with the whole team or keep it private.
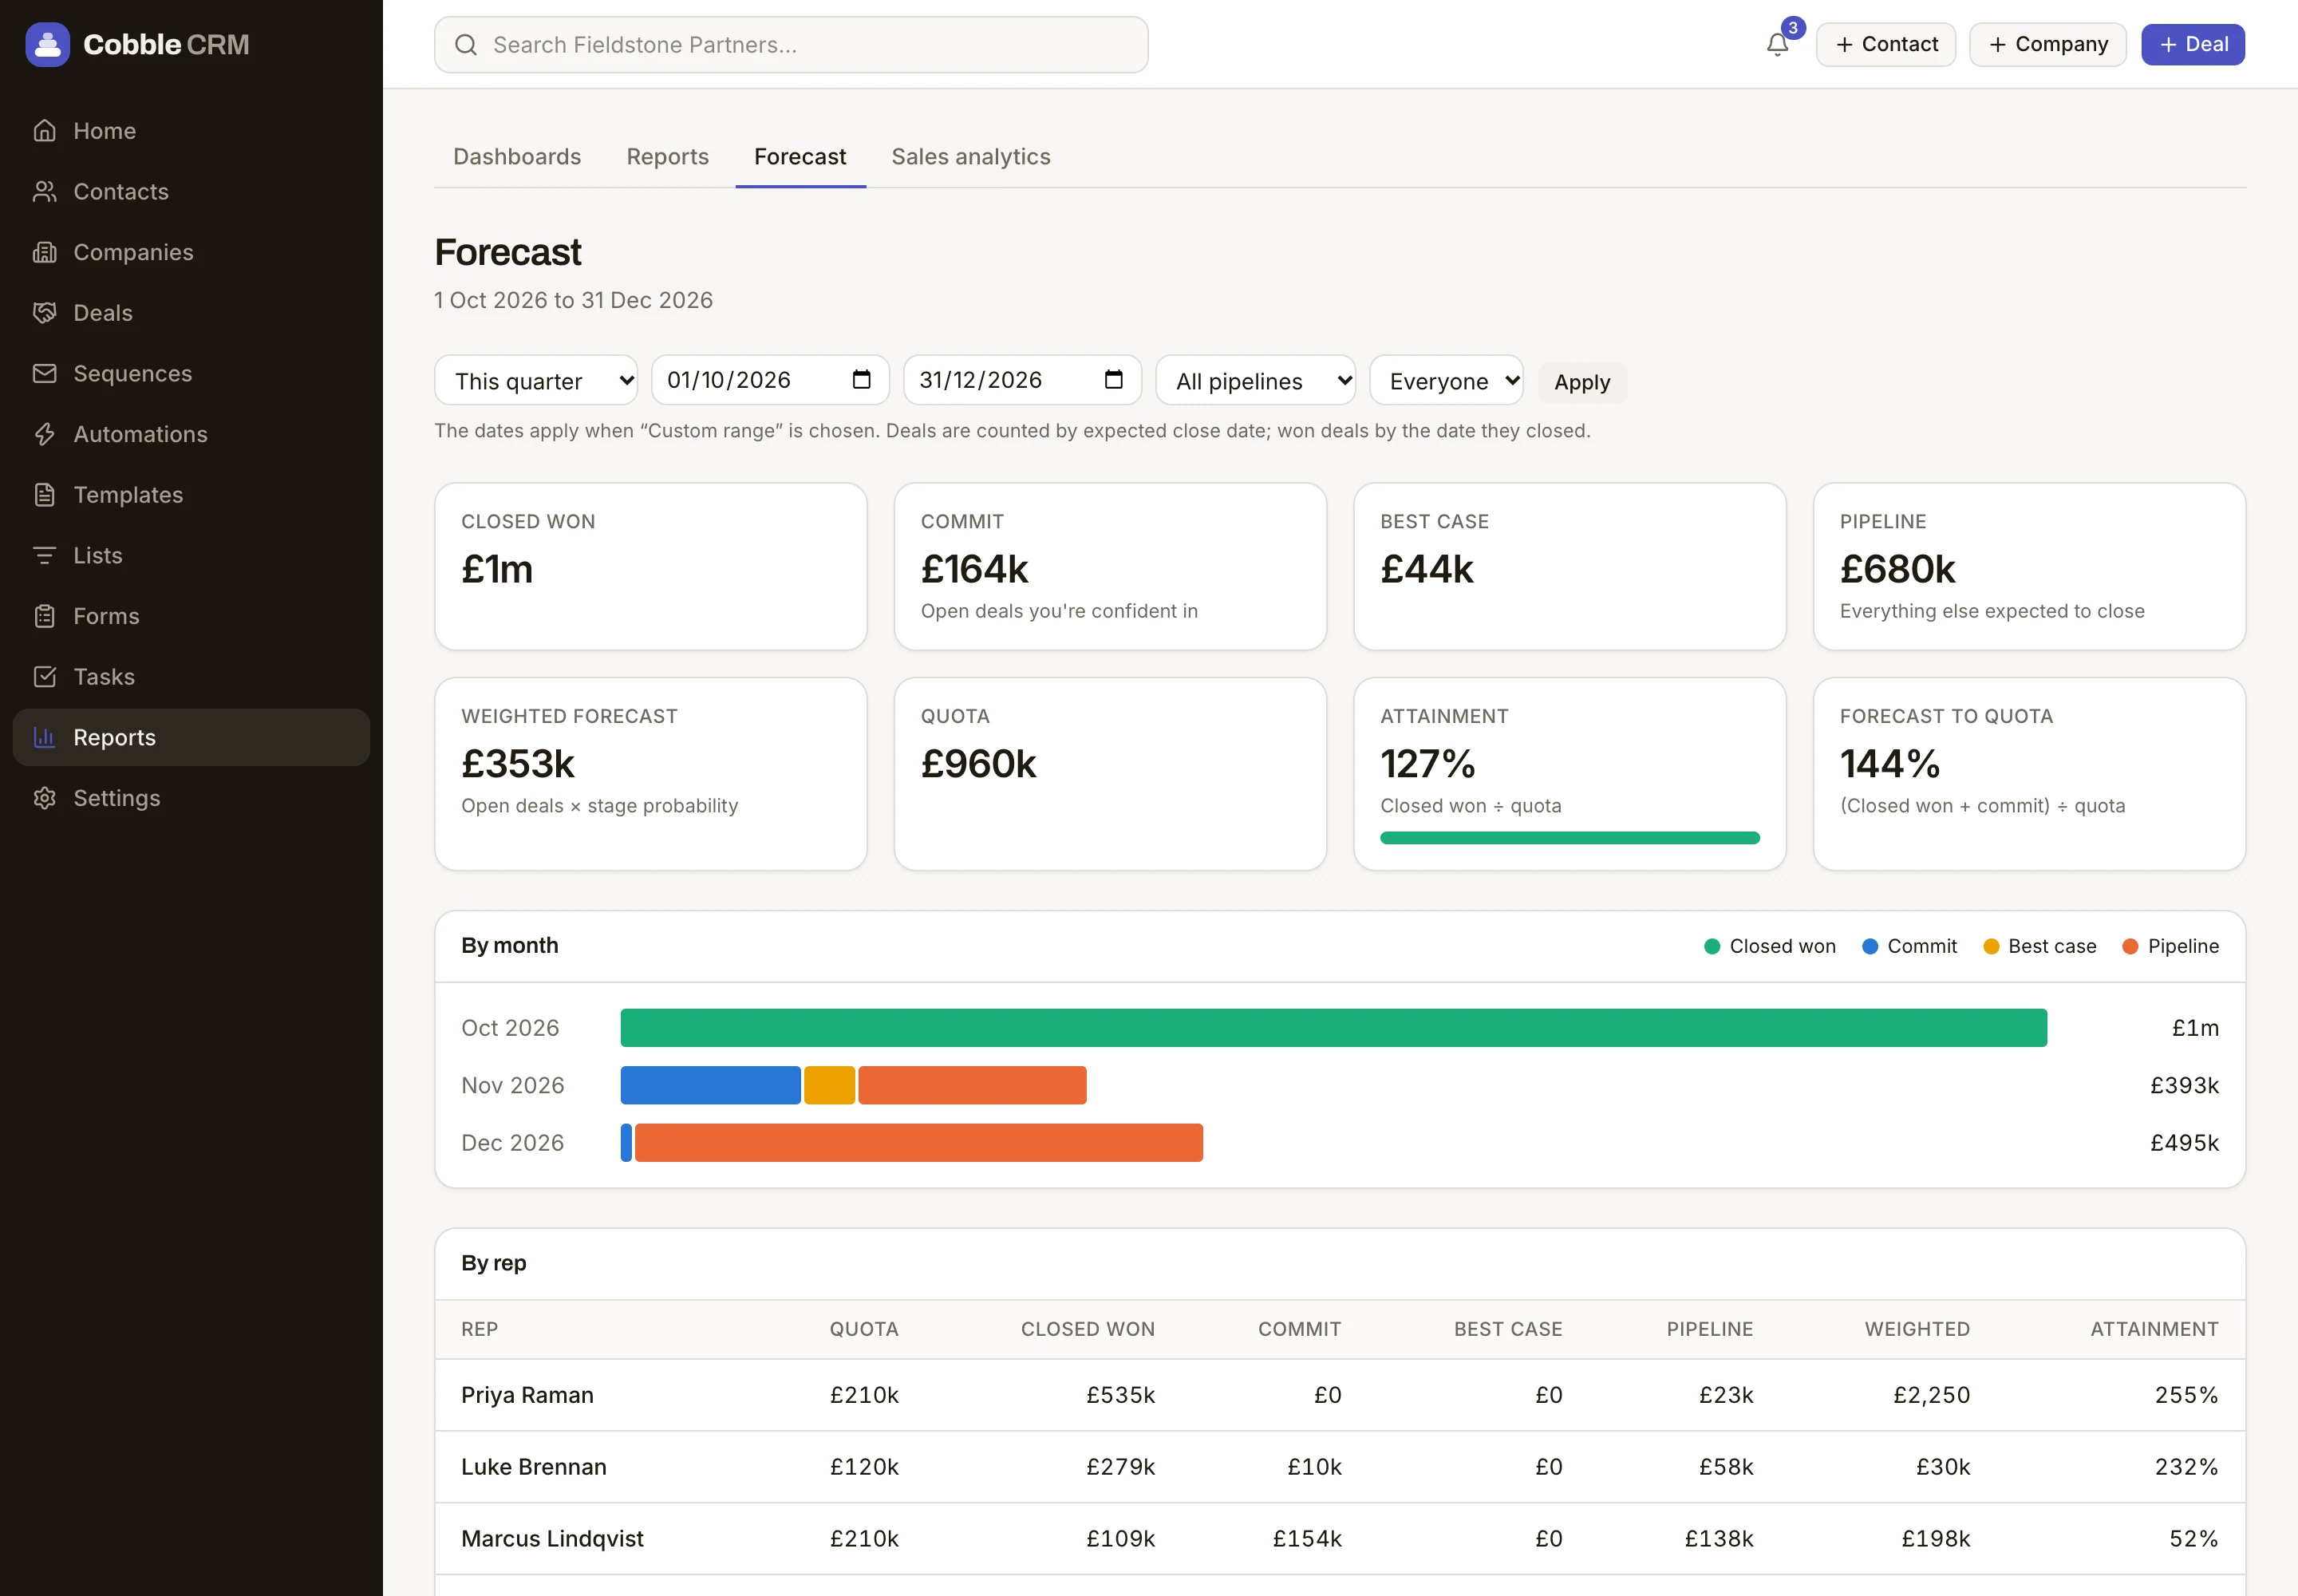
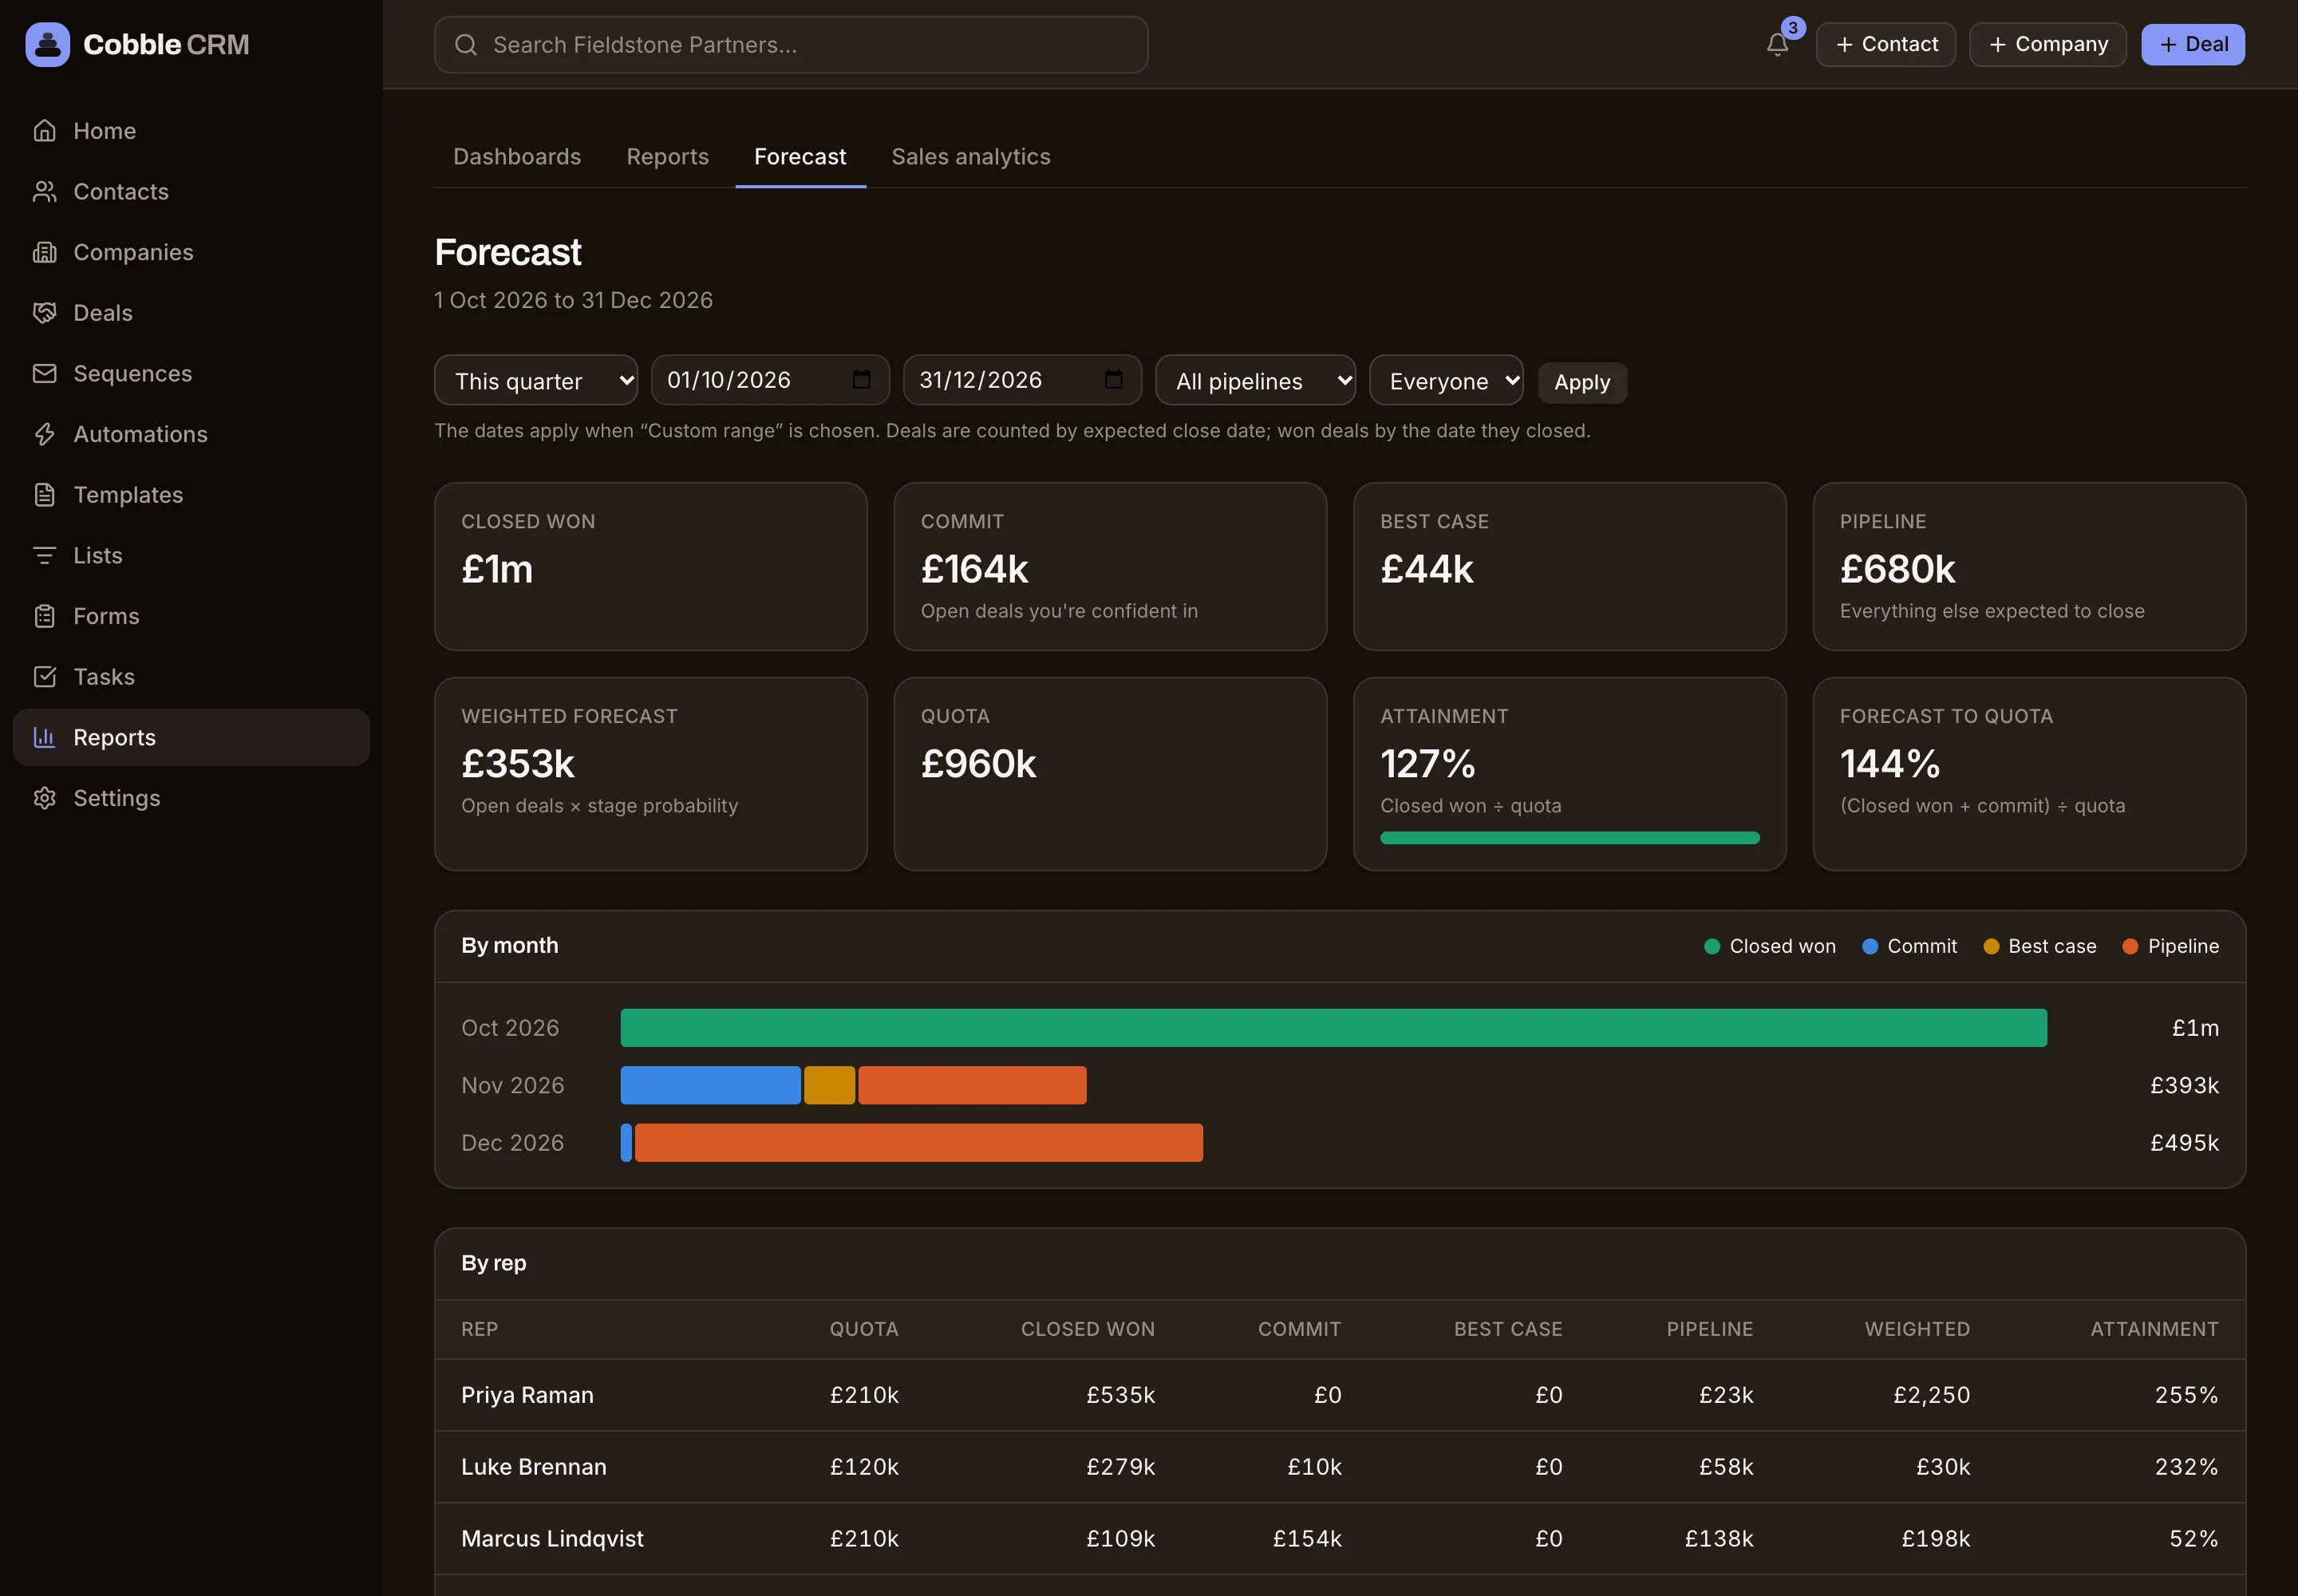
Forecast and quota
Set quotas by person and period, then see commit, best case and pipeline against them.
Funnel and time in stage
See conversion between stages and how long deals sit in each, so you find the real bottleneck.
Win rates and cycle length
Break results down by owner, source or pipeline to see what is working.
Forecast against quota, by rep
Commit, best case and pipeline for every person and team, compared with the number they have been set.
- Shared dashboards
- Quota and forecast
- Funnel and stage analytics
- Win rate and cycle length
Questions
Do reports respect permissions?
Yes. People only see the records their role allows, and reports are calculated from those records.
Can I export a report?
You can export the data behind a report as a CSV, and exports are recorded in your audit log.
Start free. Be selling in minutes.
Try Cobble with your real pipeline for 14 days. No credit card, no setup call, no pressure.